TL;DR:
- Selecting the appropriate spectroscopic method has direct regulatory and operational implications.
- Robust validation and ongoing model monitoring are essential for regulatory compliance and data reliability.
- Integrating AI and chemometrics enhances analysis but requires careful validation and interpretability documentation.
Even the most well-equipped R&D labs can face regulatory setbacks when spectroscopic technique selection and method validation are misaligned with compliance requirements. For biomedical and pharmaceutical teams, the consequences range from delayed submissions to failed audits. Choosing between UV-Vis, FTIR, Raman, NMR, NIR, and THz is not just a technical decision; it is a strategic one with direct regulatory implications. This guide maps the core spectroscopic methods, operational workflows, validation frameworks, and emerging trends that R&D managers need to make confident, compliant decisions at every stage of materials characterization.
Table of Contents
- Core spectroscopic techniques for pharma and biomedical R&D
- How spectroscopic analysis works: Methodologies and integration
- Regulatory validation: Ensuring data quality and compliance
- Tackling edge cases and advanced trends
- A new era: What most R&D leaders miss in spectroscopic analysis
- Where to find advanced spectroscopic analysis services
- Frequently asked questions
Key Takeaways
| Point | Details |
|---|---|
| Know your techniques | Choosing the right spectroscopic method is key to robust material analysis and compliance. |
| Validate for compliance | ICH Q2 validation and lifecycle management are essential for passing audits and ensuring reliable results. |
| Leverage new tools | Integrating AI, chemometrics, and hybrid spectroscopy can boost sensitivity and real-time process control. |
| Plan for edge cases | Address instrument drift, spectral overlap, and model overfitting proactively to avoid regulatory setbacks. |
Core spectroscopic techniques for pharma and biomedical R&D
With the importance established, let’s anchor your analysis in the science, starting with a quick primer on the core techniques relevant to pharmaceutical and biomedical work.
Spectroscopic methods in pharma QA/QC span a wide range of modalities, each suited to specific analytical challenges. UV-Vis handles assays and dissolution testing with speed and simplicity. IR and FTIR excel at functional group identification and polymorphism screening. NMR remains the gold standard for structural elucidation of complex molecules. Raman spectroscopy covers polymorphism characterization and counterfeit detection. NIR supports process analytical technology (PAT) and real-time monitoring. THz spectroscopy addresses solid-state characterization with minimal sample preparation. Understanding which technique fits your sample type, regulatory context, and throughput requirements is where strategic decisions begin.
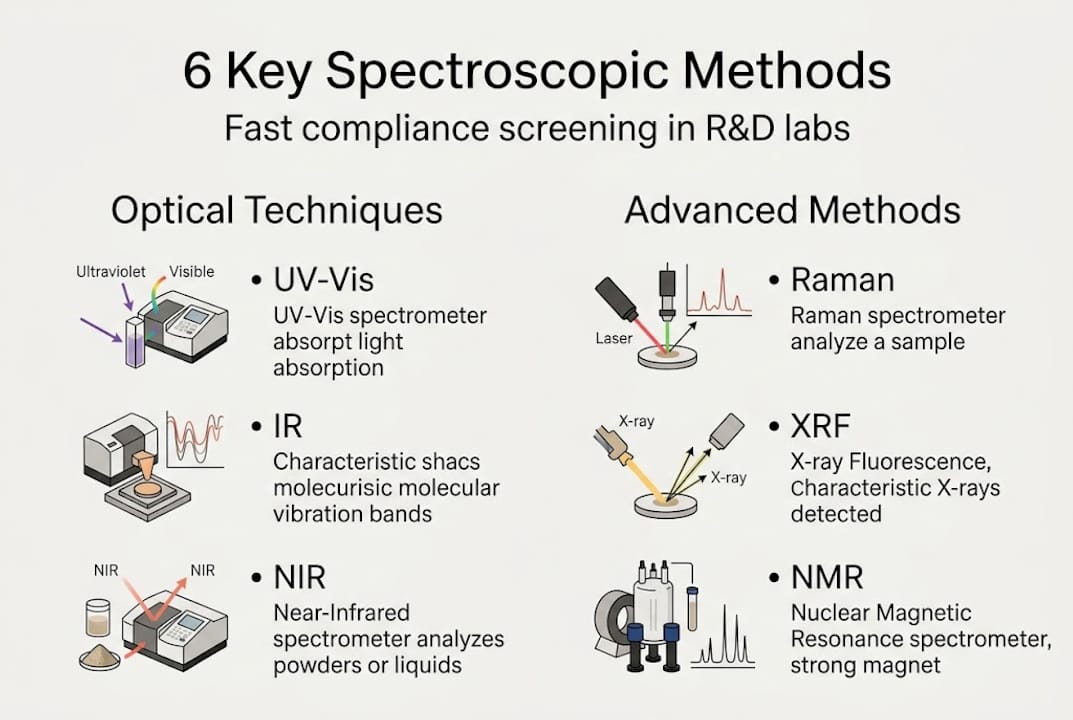
The pharma spectroscopic methods landscape also includes hybrid and emerging approaches. Raman, for example, serves a dual purpose: it confirms polymorphic form and detects counterfeit active pharmaceutical ingredients (APIs) in finished products, making it one of the most versatile tools in a QA/QC arsenal.
| Technique | Key strengths | Limitations | Typical use-cases |
|---|---|---|---|
| UV-Vis | Fast, cost-effective, high sensitivity | Limited structural info | Assays, dissolution, purity |
| FTIR | Functional group ID, polymorphism | Water interference | Raw material ID, formulation QC |
| NMR | Full structural elucidation | High cost, slow throughput | API structure, impurity profiling |
| Raman | Non-destructive, counterfeit detection | Fluorescence interference | Polymorphism, packaging QC |
| NIR | Real-time, high throughput | Calibration intensive | PAT, blend uniformity |
| THz | Solid-state, coating analysis | Limited penetration depth | Tablet coating, crystal structure |
When selecting a technique, consider these decision factors:
- Sensitivity requirements: UV-Vis and fluorescence spectroscopy offer sub-ppm detection; NMR is less sensitive but structurally definitive.
- Sample state: Solids favor Raman and NIR; liquids suit UV-Vis and NMR.
- Regulatory context: ICH Q2(R2) validation demands differ by method and data use.
- Throughput needs: NIR and UV-Vis support high-volume screening; NMR is better for targeted elucidation.
- Expertise required: Chemometrics-driven NIR and NMR require specialized data science skills.
Exploring the full range of material characterization techniques available to your team is a practical starting point for building a fit-for-purpose analytical strategy.
How spectroscopic analysis works: Methodologies and integration
Once you’ve chosen a technique, understanding its operational workflow is critical to extracting secure, compliant data.
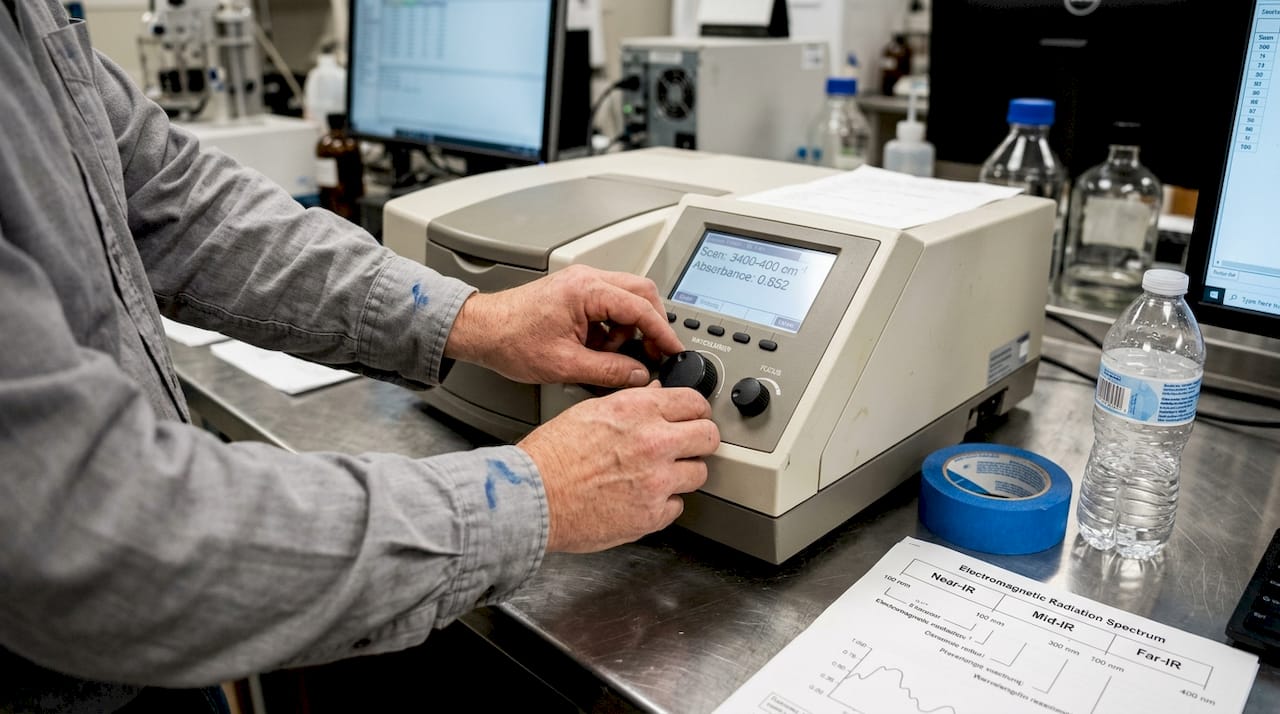
All spectroscopic methods share a foundational principle: they measure how electromagnetic (EM) radiation interacts with matter. Each molecular structure produces a unique spectral fingerprint. The instrument records this interaction across a defined wavelength range, and the resulting spectrum is interpreted to identify, quantify, or characterize the sample. The quality of that interpretation depends heavily on instrument calibration, sample preparation, and data processing protocols.
For complex pharmaceutical matrices, spectroscopy rarely operates alone. Pairing it with chromatography, particularly liquid chromatography-mass spectrometry (LC-MS) or gas chromatography-mass spectrometry (GC-MS), provides both separation and identification in a single workflow. This combination is standard for impurity profiling and metabolite characterization. Our end-to-end analysis services are designed to support these integrated workflows from sample intake through final report.
| Method | Detector type | Compatible sample form |
|---|---|---|
| UV-Vis | Photodiode array | Solutions, films |
| FTIR | MCT, DTGS | Solids, liquids, gases |
| Raman | CCD array | Solids, liquids, powders |
| NMR | Superconducting magnet | Solutions, solids |
| NIR | InGaAs array | Powders, tablets, liquids |
| THz | Photoconductive antenna | Solids, coatings |
Integrating spectroscopy into a PAT or Quality by Design (QbD) framework follows a structured workflow:
- Define critical quality attributes (CQAs) and critical process parameters (CPPs).
- Select the spectroscopic method that monitors the relevant CQA in real time.
- Develop and validate a chemometric calibration model using representative reference samples.
- Deploy inline or at-line instrumentation with automated data capture.
- Establish control limits and alert thresholds aligned with your process design space.
- Monitor model performance continuously and schedule recalibration intervals.
The top NIR applications in biopharma now include real-time fermentation monitoring, moisture content tracking, and API concentration control, all enabled by robust chemometric models. Coupling these with integrating Raman methods in a hybrid configuration adds structural specificity to the process monitoring loop.
Pro Tip: Hybrid NIR-Raman systems paired with AI-driven chemometrics are gaining traction for closed-loop bioprocess control. They allow simultaneous monitoring of physical and chemical CQAs, reducing the need for offline sampling and accelerating batch release decisions.
Understanding the broader chemical analysis frameworks that govern these workflows helps your team align instrument choices with data governance requirements from the start. The biopharma spectroscopy integration literature reinforces that early-stage method design is the strongest predictor of downstream regulatory success.
Regulatory validation: Ensuring data quality and compliance
With methodology in place, the next hurdle is proving your data will stand up to audits and regulatory scrutiny.
ICH Q2(R2) is the primary guideline governing analytical method validation for pharmaceutical applications. It requires demonstration of accuracy, precision, specificity, linearity, range, limit of detection (LOD), limit of quantitation (LOQ), and robustness. Each parameter must be documented with defined acceptance criteria before the method is used for regulatory submissions. ICH Q1 extends this framework to stability and photostability testing, where spectroscopic methods like UV-Vis and FTIR are routinely used to track degradation products over time.
The ICH Q2(R2) validation framework also requires that methods be validated in the context of their intended use. A method validated for raw material identification is not automatically valid for quantitative impurity profiling. This distinction trips up many teams during audits.
Key steps in a compliant validation workflow:
- Define the method’s scope and intended use before selecting validation parameters.
- Establish reference standards with documented traceability (USP, EP, or in-house).
- Run specificity experiments to confirm no spectral interference from excipients or degradants.
- Generate linearity data across the full analytical range, targeting correlation coefficients at or above 0.999.
- Assess precision at repeatability and intermediate precision levels across multiple days and analysts.
- Document robustness by deliberately varying parameters like temperature, humidity, and solvent lot.
Validated UV-Vis and FTIR methods routinely achieve linearity correlation coefficients of R²=0.999 or higher, a benchmark that regulators use as a baseline indicator of method reliability.
Spectroscopy also underpins QbD strategies by providing the real-time data needed to define and defend your process design space. Our analytical testing for compliance work integrates validation documentation directly with regulatory submission packages.
Pro Tip: Match your method’s validation rigor to the regulatory stake of the data. A screening assay used internally needs less validation depth than a release method submitted to the FDA or EMA. Over-validating low-stakes methods wastes resources; under-validating high-stakes ones creates audit risk.
Common audit failures include insufficient specificity data, undocumented instrument drift monitoring, and missing intermediate precision records. The spectroscopic tools in stability testing literature highlights how FTIR and UV-Vis are particularly prone to drift-related errors when instrument qualification schedules are not enforced.
Tackling edge cases and advanced trends
Even with robust validation, complex samples and evolving technology present unique analytical challenges.
Real-world pharmaceutical samples rarely behave like reference standards. Spectral overlap in IR is common when formulations contain multiple chemically similar excipients. Fluorescence interference in Raman can mask API signals in colored or biological matrices. NIR calibration models are sensitive to particle size distribution, moisture content, and temperature, making them difficult to transfer between instruments or manufacturing sites. NMR, while structurally definitive, carries high per-sample costs and requires significant operator expertise.
Common challenges and mitigation strategies:
- Spectral overlap (IR/FTIR): Use multivariate analysis (PLS, PCA) to resolve overlapping bands; increase spectral resolution where instrument hardware allows.
- Fluorescence interference (Raman): Switch to near-infrared excitation (785 nm or 1064 nm) or use shifted excitation Raman difference spectroscopy.
- Calibration complexity (NIR): Build calibration sets that span the full range of expected sample variability; validate transfer protocols between instruments.
- Instrument drift: Implement system suitability tests before each analytical run and schedule routine qualification per manufacturer and pharmacopeial standards.
- Matrix effects: Validate in the actual sample matrix, not just in pure solvent, to capture real-world interference patterns.
AI and machine learning (ML) are reshaping how spectroscopic data is interpreted. AI-matched accuracy in spectroscopic benchmarks now rivals expert human performance in classification tasks. However, the risks are real. Black-box models can overfit to training data, producing artificially high accuracy that collapses on new sample sets. Regulatory agencies are beginning to scrutinize AI-assisted methods, and the absence of model interpretability documentation is already flagged in some inspection reports.
Chemometrics in pharmaceutical spectroscopy remains underutilized, largely because standardization of data preprocessing steps, baseline correction, normalization, and outlier removal, varies widely between labs and instruments. This inconsistency creates reproducibility gaps that undermine both internal QC and cross-site method transfers.
Understanding the analytical testing importance of standardized preprocessing is a practical first step toward future-proofing your QA/QC strategy as AI tools become more embedded in regulatory workflows.
A new era: What most R&D leaders miss in spectroscopic analysis
Most R&D leaders treat validation as a finish line. Once the method passes ICH Q2(R2) requirements, it gets filed and largely forgotten until the next audit. That mindset is increasingly costly.
The real risk is not initial validation failure; it is model drift, instrument aging, and evolving sample complexity that quietly erode data quality over time. Continuous model monitoring and scheduled chemometric recalibration are not optional extras; they are the difference between a method that holds up across a product lifecycle and one that fails during a critical stability study.
We also see a persistent skills gap. Many R&D teams have deep spectroscopic expertise but limited fluency in AI and chemometrics. Cross-training scientists in the basics of partial least squares (PLS) modeling, outlier detection, and model validation builds the internal capacity to catch problems before they reach a regulator. Partnering with specialist contract research organizations (CROs) through our advanced materials toolkit accelerates this capability transfer without the overhead of building it from scratch.
Looking ahead, regulatory agencies will increasingly require AI model interpretability documentation and cross-platform data harmonization as part of submission packages. R&D leaders who build these practices now will have a structural advantage when those requirements become mandatory.
Where to find advanced spectroscopic analysis services
If you’re ready to elevate your analytical strategy with expert partnership and full compliance, here’s where to act.
At Materials Metric, we offer analytical testing compliance services that cover the full spectroscopic portfolio: UV-Vis, FTIR, Raman, NMR, NIR, and custom chemometric pipeline development. Our team supports ICH Q2(R2) validation documentation, PAT and QbD integration, and regulatory submission preparation.

Whether you need chemical elemental services alongside spectroscopic characterization or a complete material characterization services package, we function as an extension of your research team. Our ISO 9001:2015 and GLP-aligned workflows ensure your data meets the standards regulators expect. Contact us to discuss how we can accelerate your next development milestone.
Frequently asked questions
What is spectroscopic analysis and why is it crucial for pharma R&D?
Spectroscopic analysis uses light-matter interactions to reveal a material’s chemical identity and composition, making it foundational for quality control, stability testing, and regulatory submissions in pharmaceutical development.
Which spectroscopic methods are best for counterfeit detection?
Raman and NIR spectroscopies are the most effective options for rapid, non-destructive authentication of medicines and detection of counterfeit APIs in finished dosage forms.
How do I ensure my spectroscopic data meets regulatory standards?
Follow ICH Q2(R2) validation requirements by documenting accuracy, linearity, specificity, and robustness, and ensure your protocols are traceable to recognized reference standards before submission.
Can AI and chemometrics replace chemists in spectroscopic analysis?
AI-assisted spectroscopic methods match expert accuracy in many classification tasks, but regulatory acceptance still requires qualified scientist oversight, interpretability documentation, and ongoing model performance monitoring.